Set-by-step on how to build a Dashboard
Overview
A dashboard, or progress report, is a visual display of your Indicators, or KPIs. This article takes you through the basic setup of a dashboard in Mingo.
Procedure
Note: You need Dashboard Editing Permission in your security group. A quick way to find out is by clicking the arrow next to the Edit button. If you have access, you will be able to see the option New Dashboard.
- Go to Analytics
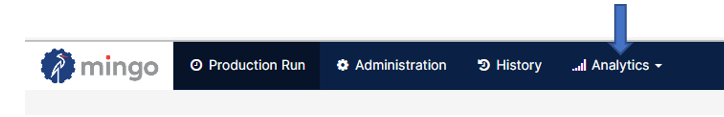
- [Click] on Dashboards

- [Click] on the arrow located in the right corner next to the Edit button and [click] on the New Dashboard option.

- You will see a pop-up of the Dashboard's Settings.

- Let's assume you want to have an "OEE Dashboard".
- Here you can change the title of the dashboard.
- Select if you would like to share with others.
- Enable the ability for others to edit the dashboard.
- How often you would like the information to refresh.
- The layout of the dashboard.
 The structure follows a website grid.
- To start populating your dashboard, you would need to create a widget. [Click] on Add Widget and select the one you would like on your dashboard.

- Tile
 : a snapshot of a specific metric with a small trend underneath
 - Table: rows and columns
- Line/Bar/Area Chart: historical data represented by connecting a series of data points with a continuous line
- Scatter Chart: data points that show how two variables are affected by each other
- Pie or Donut Chart: illustrates percentages of a whole
- Pareto Chart: a combination of bar and line charts in descending order that illustrate the most frequent causes or problems in a process
- Control Chart: shows a process change over time. It is usually used to determine if a process is under control
- Timeline: color codes the production run of a machine
- Downtime (Planned: Blue, Unplanned: Red)
- Scrap (Yellow)
- Active production (Green)
- Cell Status: visualization of current OEE, Target Quantity, Actual Quantity, Performance, Quality, and Availability.
- Tile
- Remember to Save Changes before you exit your dashboard

Except for two widgets (timeline, and cell status), the Advance button switch will allow you to view additional metrics you can select.