Dashboard Widget: Table
Displays the information in rows and columns
Content
Procedure
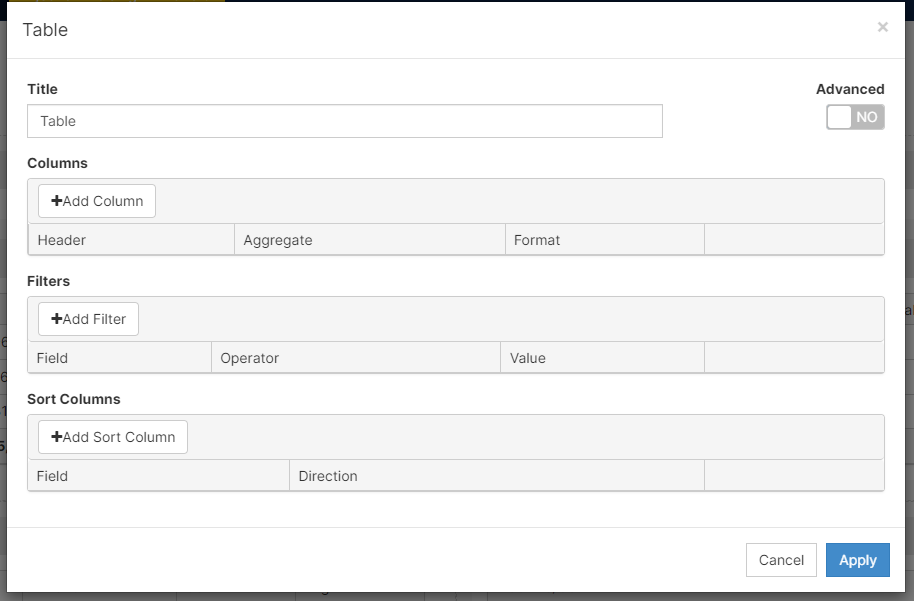
- On Add Widget, look for the Table widget. A popup should appear that looks like the photo below
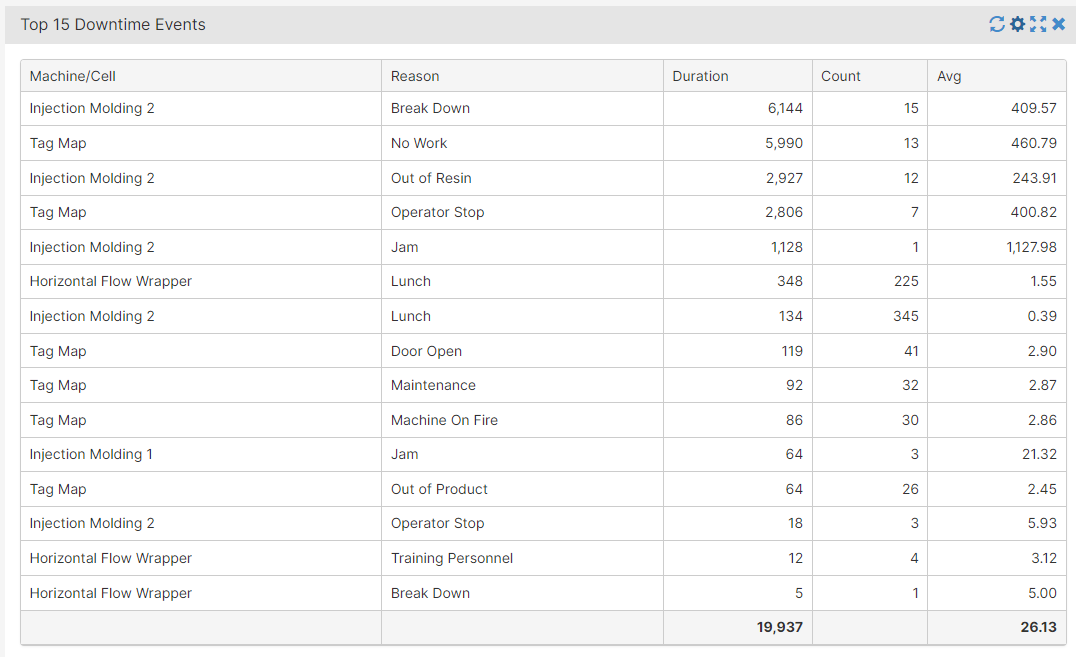
- Change the Title. For this example, we are going to use "Top 15 Downtime Events".
- When you turn on the Advanced switch, two options appear at the bottom: Maximum Rows and Show Footer Summary. For this example, we only want to look at the Top 15 Downtime Events. Hence, the Maximum Rows should be 15. The Footer Summary is the aggregated information for each column.

- [Click] on Add Column and populate your machine with the columns you want to track.
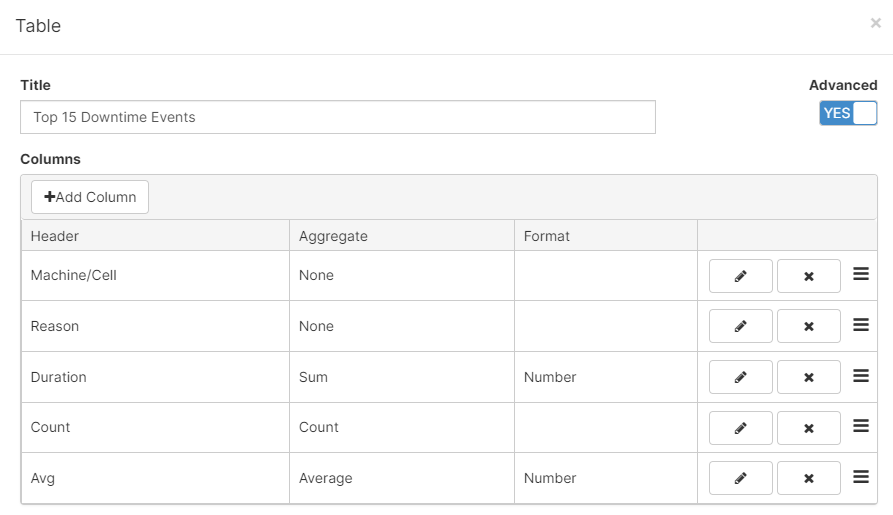
[Click] on the pencil to edit any Metric:

- [Click] on Add Filter to refine your results. In this example, we want to count only Downtime events, and ignore any other event.
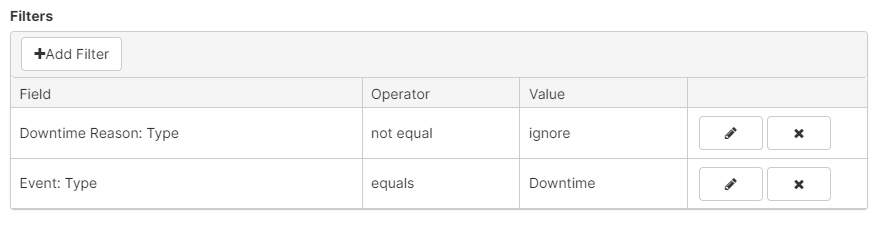 When you try to edit any of the filters, the following screen will pop up. On the screen, you will choose the Operator and Value that best fits your reporting.

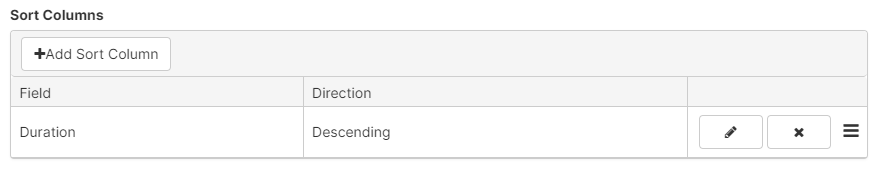
- [Click] Add Sort Column. In this case, we want the ones with the longest amount of time to be first on the list.
- At the end, we have a result that looks like the picture at the bottom.
Features
- To duplicate this widget, please select (
 ) when you are in edit mode.
- Understand and modify the widget's details by clicking on the Fullscreen button (
 )
)
- On the pop-up screen, there are two options: Export to Excel and View Details
- Export to Excel: exports the selected widget to Excel
- View Details: examine production runs, scrap codes, and downtime codes to understand the widget's summary
- you can delete, merge, and export to excel on this screen