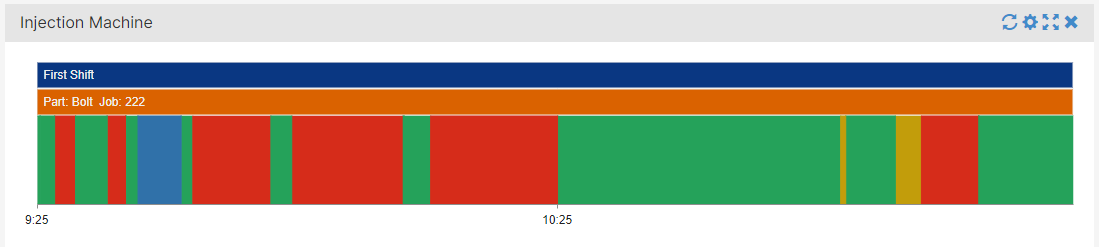
Dashboard Widget: Timeline
Color codes the production run of a machine to clearly identify good quantity, scrap, and downtime.
Procedure
- On Add Widget, look for the Timeline widget. A popup should appear that looks like the photo below
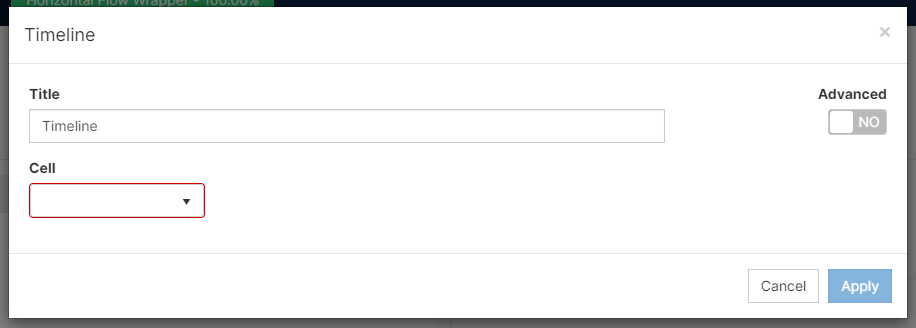
- Change the Title of the Widget
- Choose the cell or machine you would like to display
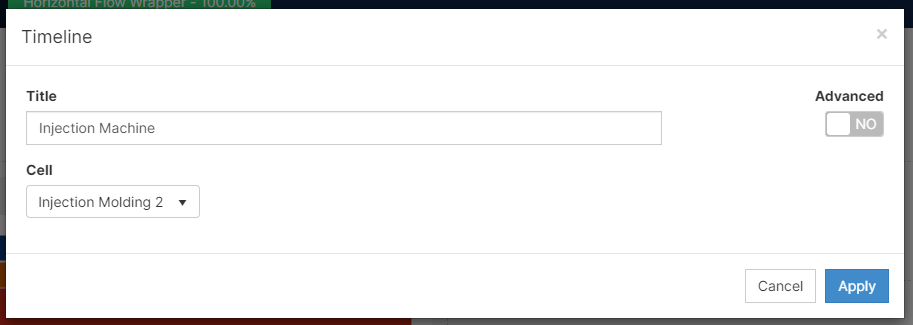
- [Click] Apply and remember to also save your changes by clicking Save Changes on the top right corner.
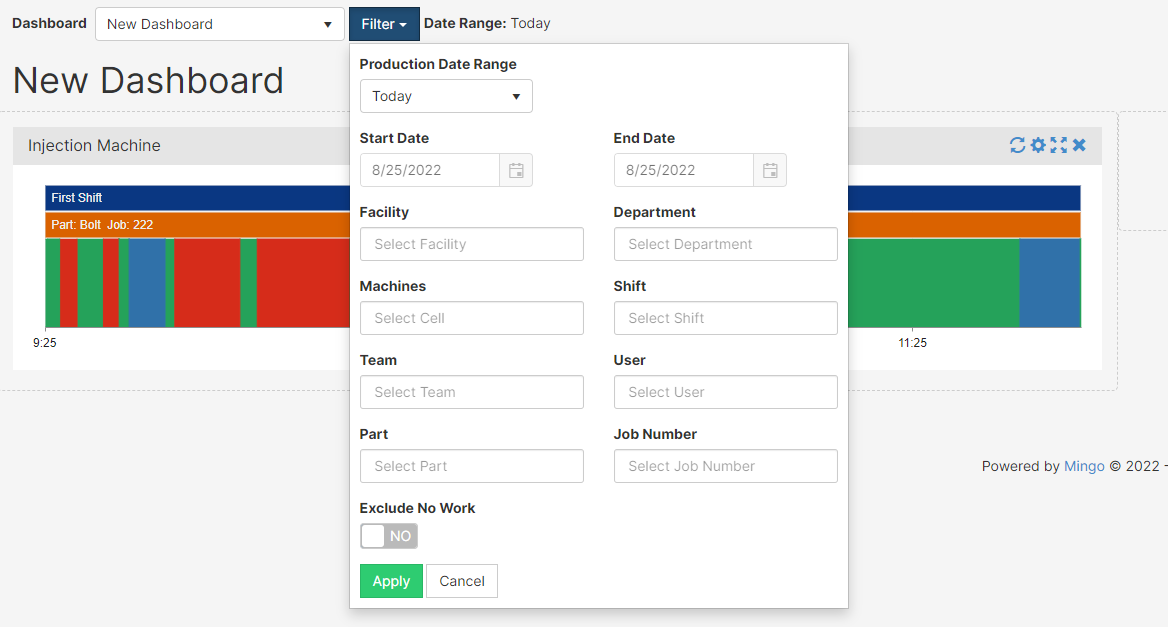
- If you need to filter it in any way, you can always use the Filter button next to the dashboard name.
Features
- Understand and modify the widget's details by clicking on the Fullscreen button (
 )
)
- On the pop-up screen, there are two options: Export Image and View Details
- Export Image: exports the selected image to your computer
- View Details: examine scrap codes and downtime codes to understand the widget's summary
- you can export to excel on this screen