Dashboard Widget: Tile
A single line snapshot of your data
Procedure
- On Add Widget, look for the Tile widget. A popup should appear that looks like the photo below.
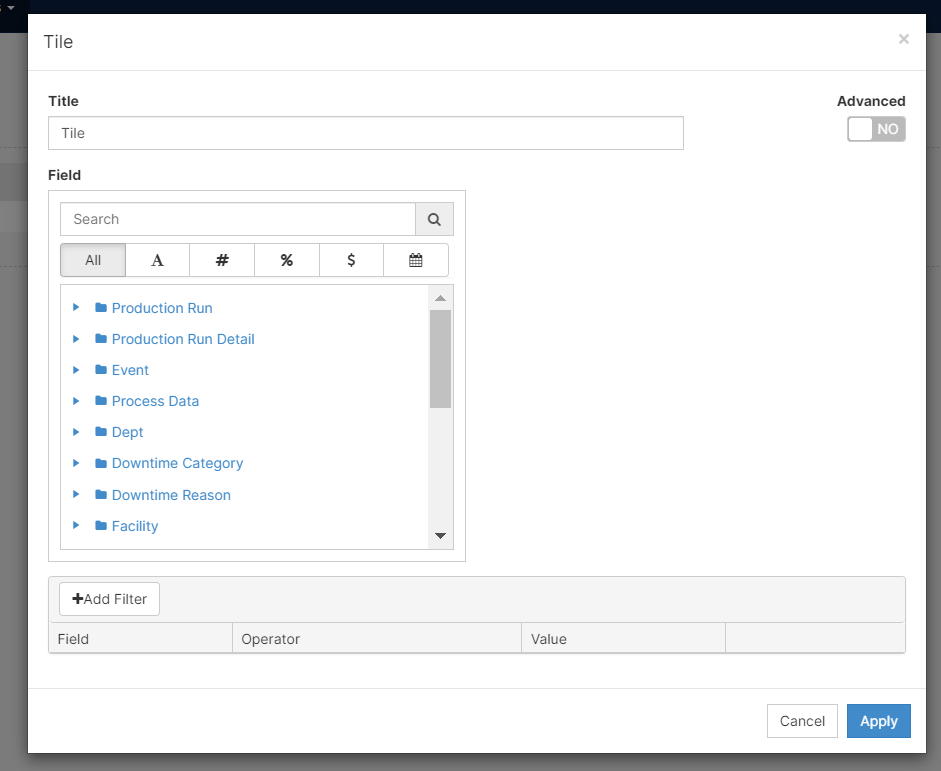
- Add the Title of your choosing
- On the Field, you can either use the search bar to find the metric you need or go through the folders you see on the screen (Production Run, Production Run Detail, etc.).
- Once you find a metric you would like to use, [Click] on the metric for the option menu to appear.
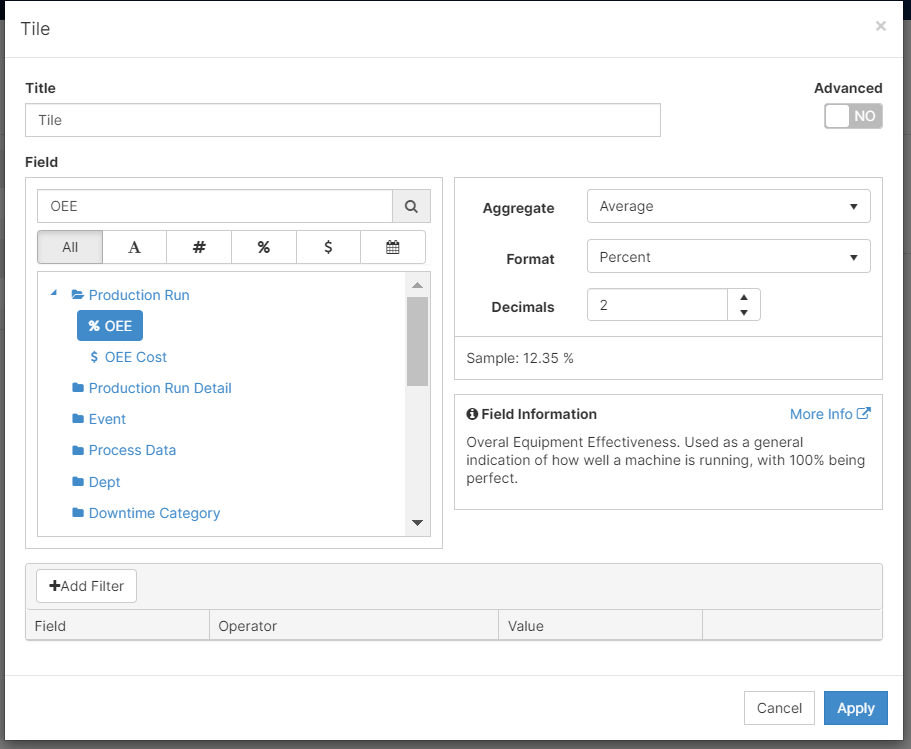
- For some metrics, you are able to select how you would like to aggregate it. In other cases, like % OEE, the predetermined aggregation is "Average".
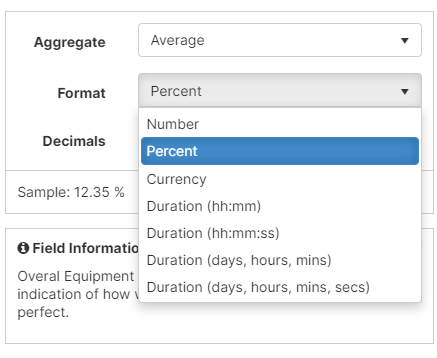
- Select the Format you would like the metric to display from the dropdown menu
- Using the arrows or typing it on the bar, you can add the number of Decimal points your metric will have.
- If you have any questions about the definition of the metric, you can look at the Field Information for a brief explanation.
- If you want to filter your metric, you can [Click] Add Filter in the bottom
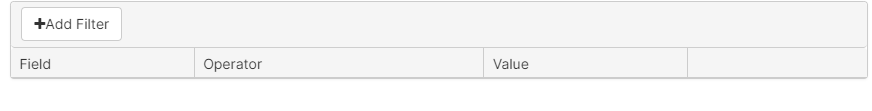
- You can select your Operator (a character that represents an action) from the dropdown menu and fill in the Value. When you are done, remember to [Click] Update.

- When you are done, the widget should look like this:

Features
- Understand and modify the widget's details by clicking on the Fullscreen button (
 )
)
- On the pop-up screen, there are two options: View Details
- View Details: examine production runs, scrap codes, and downtime codes to understand the widget's summary
- You can delete, merge, and export to excel on this screen