Understand how Mingo can be used in your facility
Summary
Mingo translates data obtained manually or through PLCs to useful scoreboards and dashboards. Additionally, Mingo provides an alert functionality that will send an email or mobile notification (the Mingo App needs to be downloaded) when a specific condition is met. For example, when a machine or cell performs below 80 percent, and the situation has to be address immediately in order to meet the production schedule. Apart from performance, Mingo can set alerts for production, events, and process data.
On the operator screen, the operator or supervisor is able to edit events, look at the machine's current metrics (like OEE, quality, availability) , create forms, and manually report downtime and scrap. This screen shows the operator their progress on the current work order.
More information about the Operator Screen can be found here.
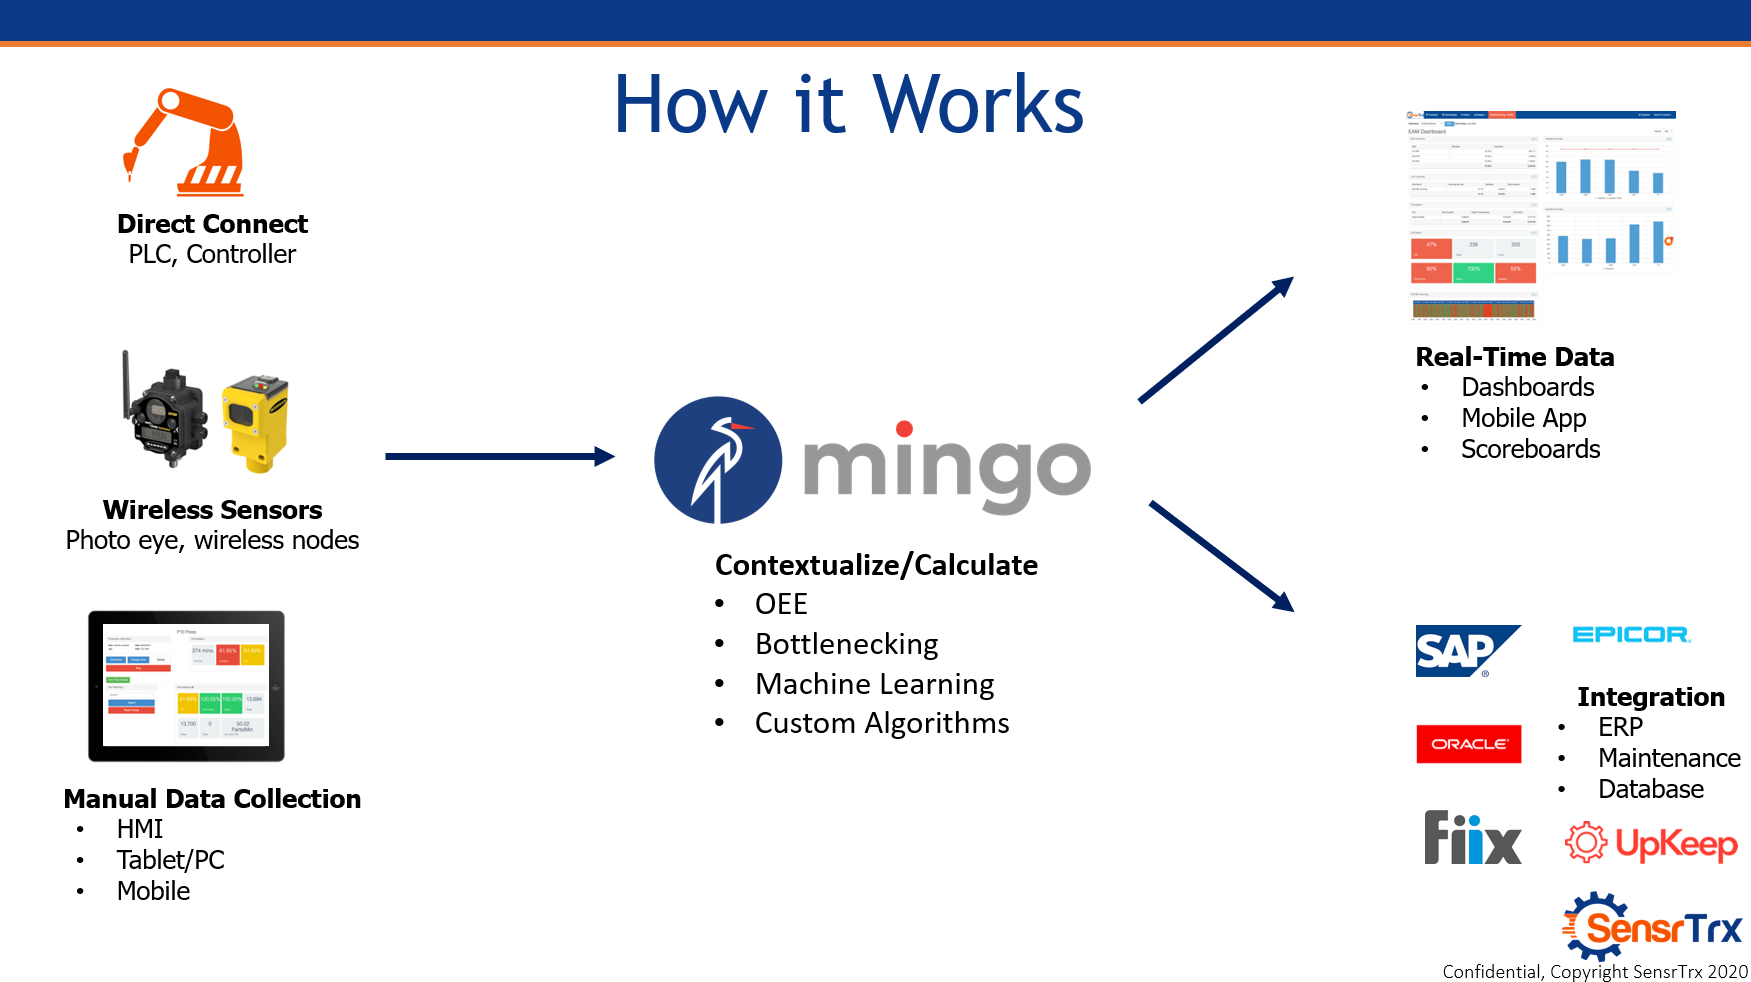
Mingo Lean Architecture
There are multiple ways Mingo can get information from your facility: sensors, direct connect to your PLCs, or manual data collection. The information can be displayed on a TV, using Amazon's Fire Stick, Tablets or Computers.
Data Types
- Quantity is the amount of good product manufactured during a production run.
- Scrap is any non-conforming product obtained during a production run.
- Downtime is the time a machine is inactive. Mingo classifies downtime as planned (like lunch, breaks, schedule events) or unplanned (like material break, idle, unscheduled events).
- Process Data is data collected to understand how and why the process performed the way it did. For example, if there is an increase in scrap data, it might be because the temperature has decreased in a rod or tank.
KPIs
Key Performance Indicators refer to process measurements that focus on strategic improvement for your facility.This is just a small sample of KPIs you can track with Mingo.
OEE
Overall Equipment Effectiveness identifies how truly productive a run time was. OEE is composed of three factors: Availability, Performance, and Quality. With Mingo, you can focus on different days, shifts, and machines using filters, since it aggregates the information for you.
More information about OEE can be found here.
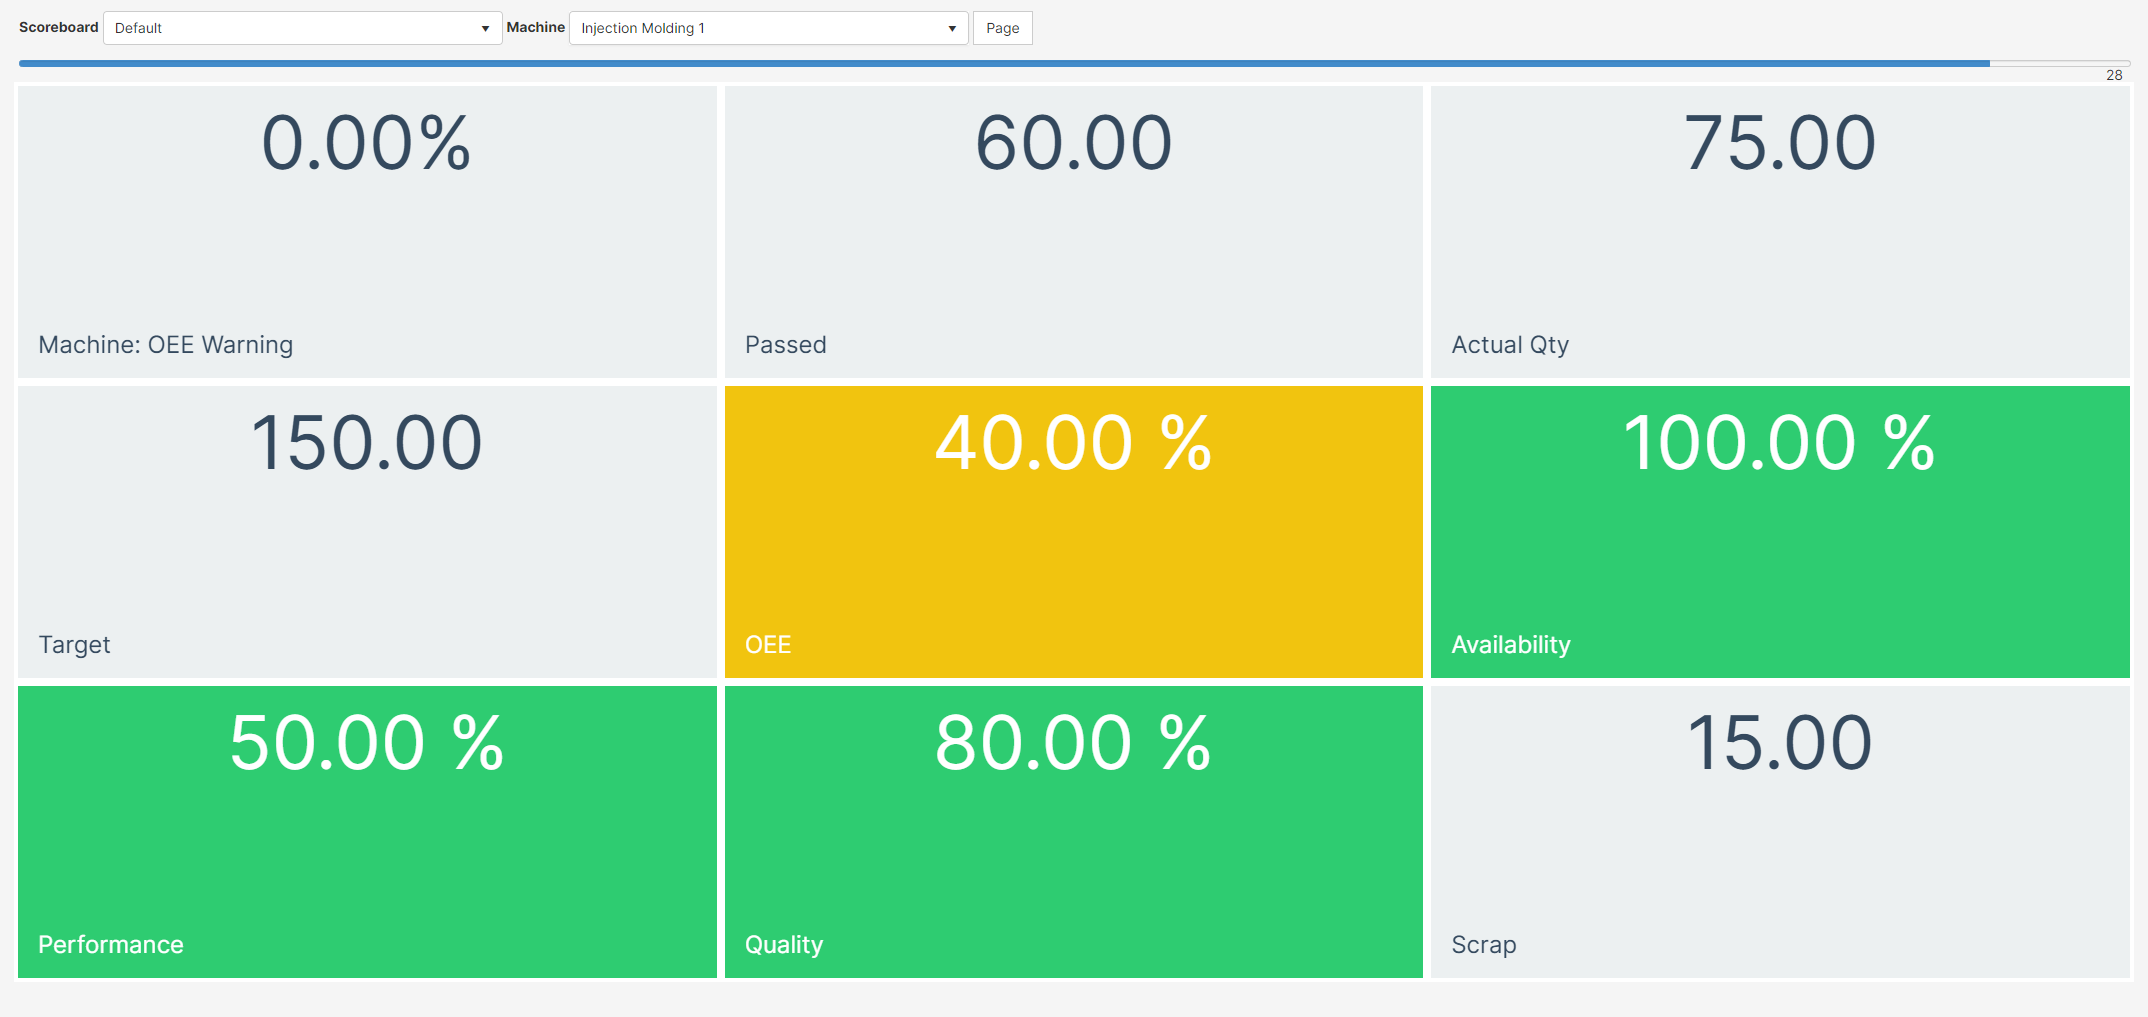
Scoreboards
Scoreboards display real-time KPIs and metrics. Mingo provides three types of scoreboards: Single Machine (like the image below), Single Machine with previous shifts, and Multiple machines. Scoreboards are mostly used to know if the current production is on track, and if any machine is down.
More information about Scoreboards can be found here.
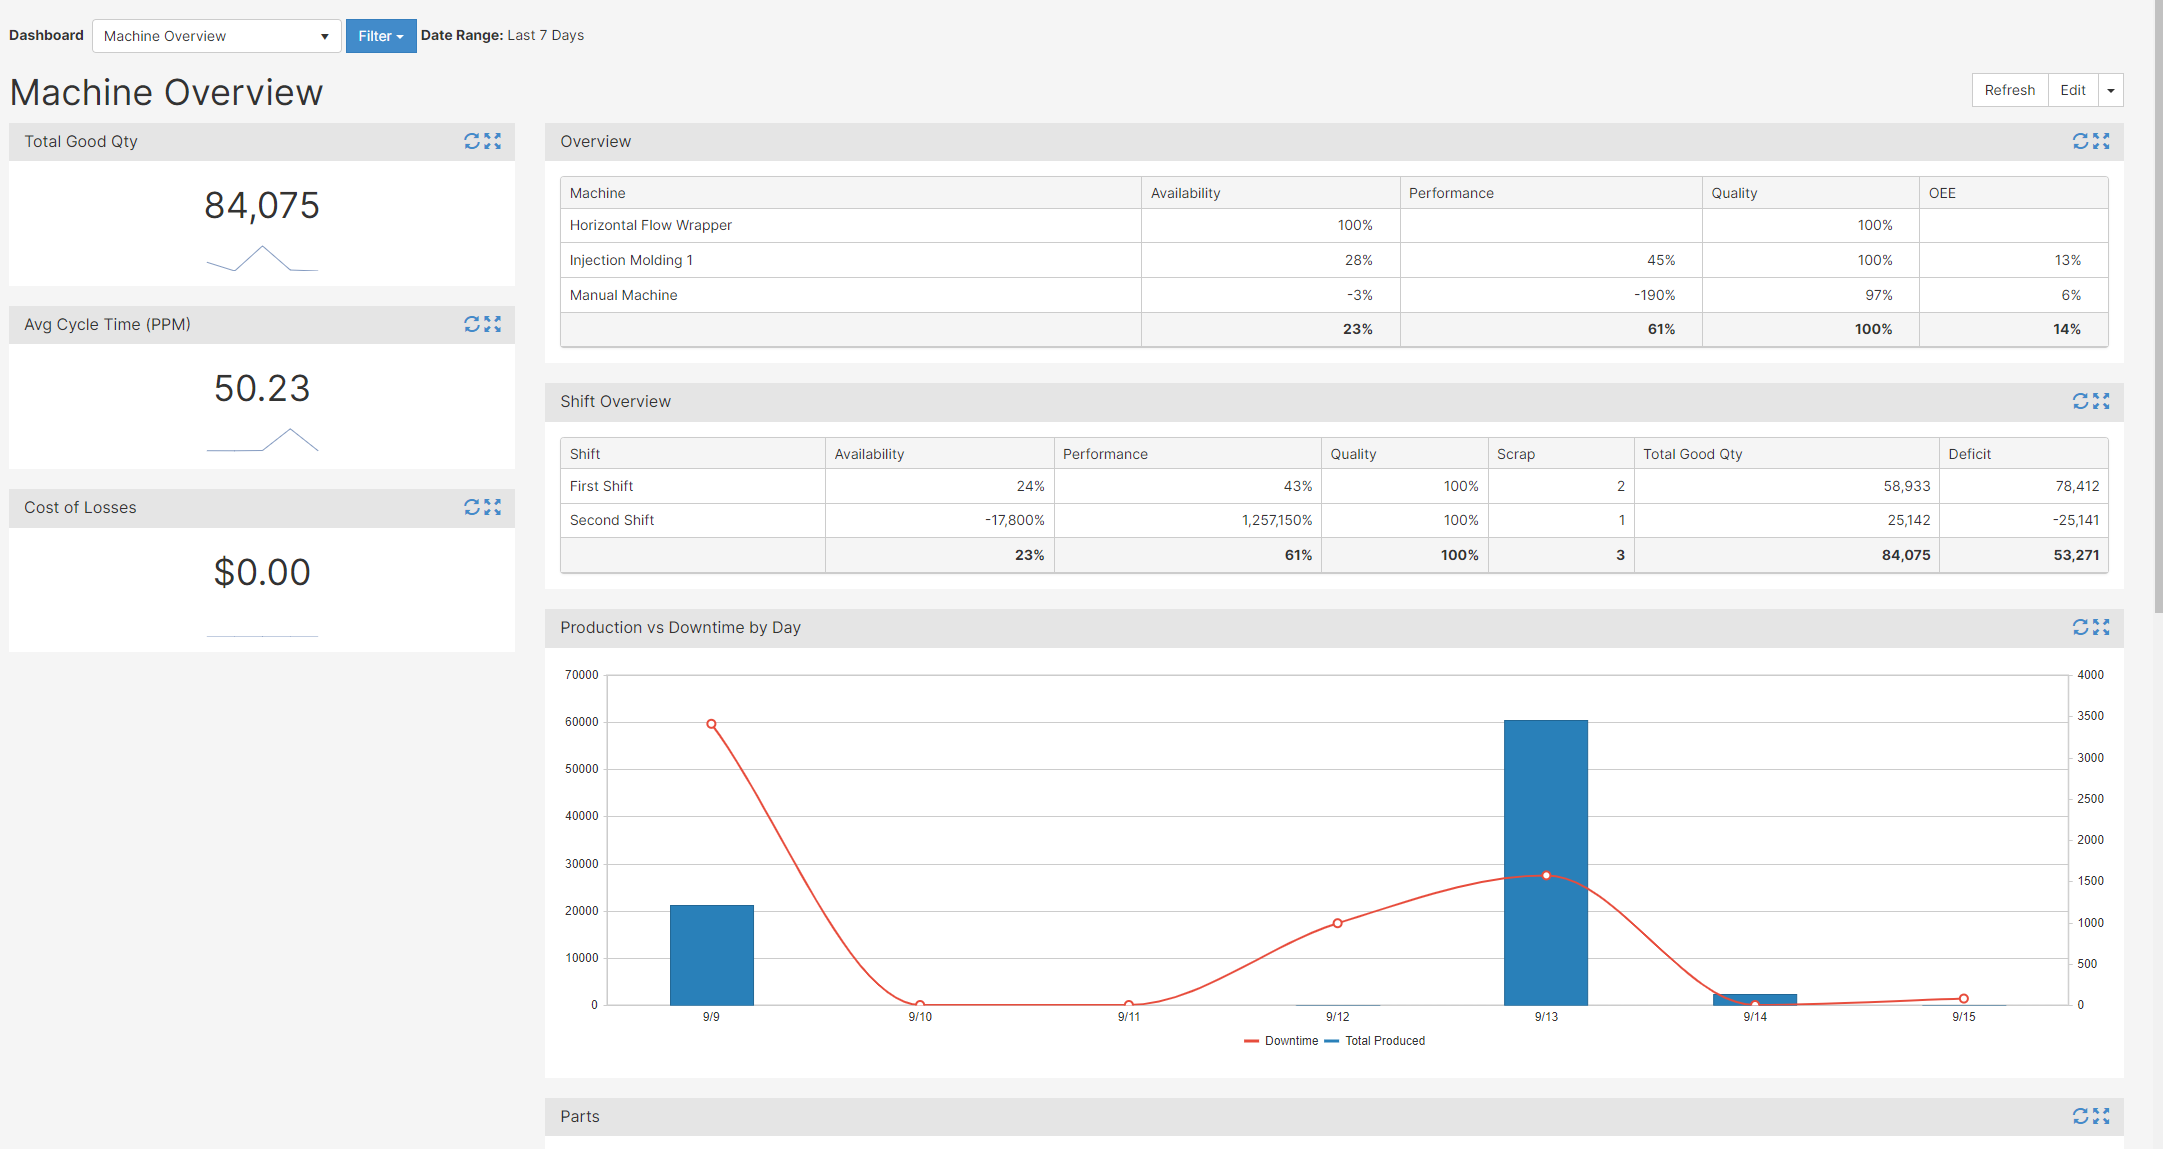
Dashboards
Dashboards use historical data to create data-driven reports. These reports can be sent automatically using Mingo. Recipients of the dashboard will receive a collective email on a set schedule.
Dashboards provide widgets like tiles, pareto charts, timelines, tables, among others. The information can be refreshed manually or every 30 seconds to an hour.
To start your data driven process, Mingo sets a few predetermined dashboards into your environment. However, we highly encourage you to add dashboards to customize your company.
More information about Dashboards can be found here.
Video