Overview of the Mingo's Scoreboards
Overview
The scoreboard is a real-time view of production.
You have the ability to display any metrics that are tracked by the system. We have included a set of standard metrics to choose from, but you can also create custom expressions to show other data.
Scoreboard Layout and Display
There are two types of scoreboards: Production and Scheduled based. Production Scoreboards focus on the production run while the Schedule Scoreboards focus on the Work Orders.
Data Source: Production
There are three different scoreboard layouts: Table, Table with Prior Shifts, and Tile. Data will populate the scoreboards when a production run runs on the machine.
To learn more about how to build a Production Scoreboard, please click here.
Production Not Running
When a machine, line or cell is not running a message will be displayed at the top of the scoreboard. The figure below shows an example of the message. As soon as a production record starts, data will be displayed.

Data Source: Work Order
This data source has one layout: Work Order. Data will populate the scoreboard when a work order matches the filters on your settings. 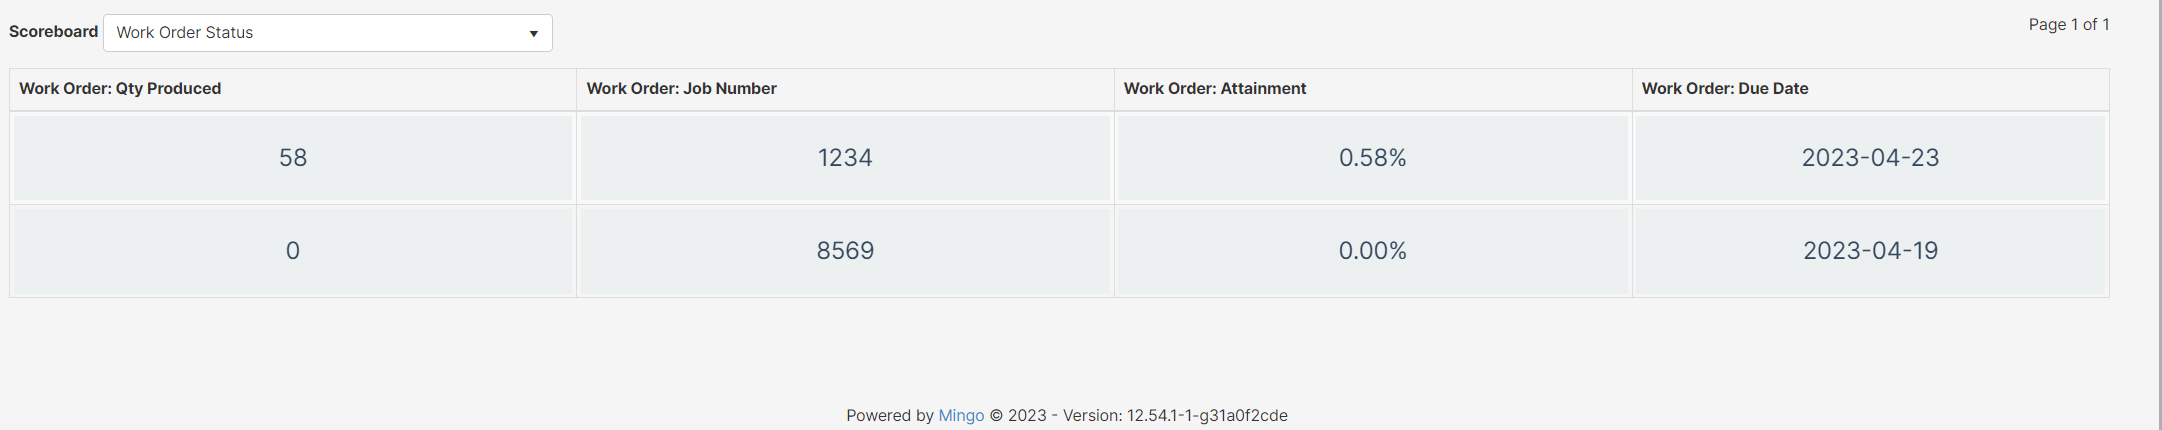
To learn more about how to build a Schedule Scoreboard, click here.
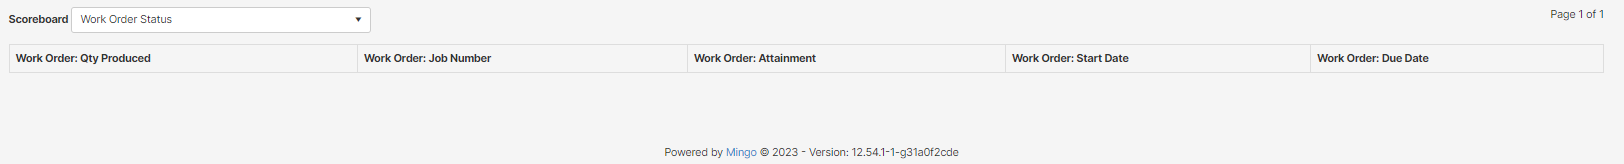
Work Order Outside the Filtered Data
Make sure the filters are correct on your scoreboard. If there are no work orders associated with those filters, the scoreboard will look something like this:
Conditional Formatting on Numerical Values
Color code metrics based on expressions established by the user on scoreboards.
To learn more about "Conditional Formatting on Scoreboards", please click here.
Screen Forecast
There are multiple ways to display Scoreboards. You can use websites like Vysor (which displays your phone on a screen), and Vuepilot (which allows you to manage screens from your computer).
Advanced Tab
Custom Label and Expression
Creating your own expressions is an advanced functionality and requires some knowledge of field names and how Mingo publishes data. Please contact support if you have questions, we are happy to help you configure these.
The scoreboard metrics have an expression language that allows you to display any data in the system, do calculations, and format the results.
Expressions can be text, data, or a combination. For example:
- Target Total Quantity for Shift
- Actual and target quantity in the same box
- targetTotalQty is rounded up
- Target parts per hour at the OEE Target
Reference sites:
Here are some good articles on how to build these kinds of expressions:
Expressions: http://angularfirst.com/angular-expressions-2/
Filters: https://angularfirst.com/angular-filters/