Create a scoreboard start to finish with Production as the data source.
Overview
Scoreboards with this data source have access to the following tables: Production Run, End of Run Reports, Department, Facility, Machine, Part, Scheduled Shift, Shift, Team, User, Work Order, Widgets. The information will update in real-time, and you will be able to have a snapshot of your production floor.
Procedure
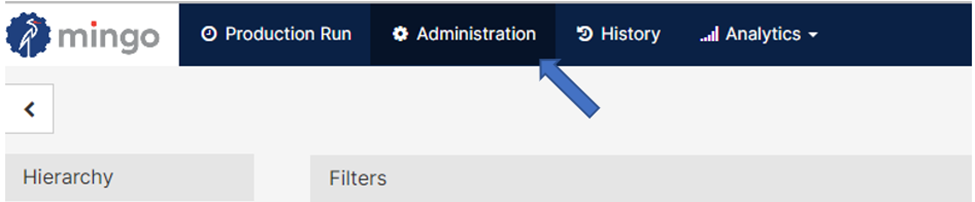
- On the top, [Click] on the Administration Tab.
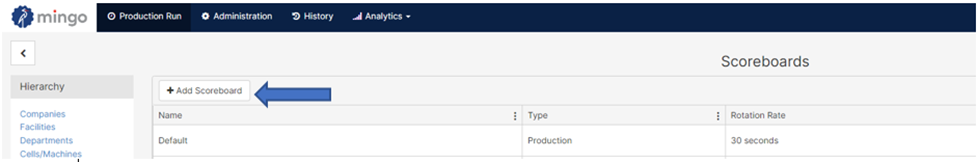
- [Click] on Scoreboards, on the left side of the screen.

- [Click] on the button Add Scoreboard.
- A popup will appear on your screen. Provide a Name for the scoreboard that embodies your analysis, and assign the scoreboard to a Type (Production, Work Order). In this screen, you can also select how often this scoreboard will refresh with the Page Change Interval. When you are finished, [Click] Confirm.

- Add Metrics to your scoreboard to populate your scoreboard. Metrics like OEE, Availability, Performance, and Scrap Quantity are popular among many facilities.
- There are different types of metrics in Mingo. If you want a specific one, use the Search bar to locate it. For example, if you are looking for the metric Actual Cycle Time, then the Production Run folder will have an arrow telling you there are matching metrics to your search.

You can also filter by data type. The figure below shows the different data type in Mingo.
- When you [Click] on your selected metric, you can edit the Label, Format, and Decimals. [Click] Update to add the metric to your scoreboard.

- After all your metrics are created, you will be able to see them and organize them by simply clicking the
 icon and dragging it up or down the scoreboard.
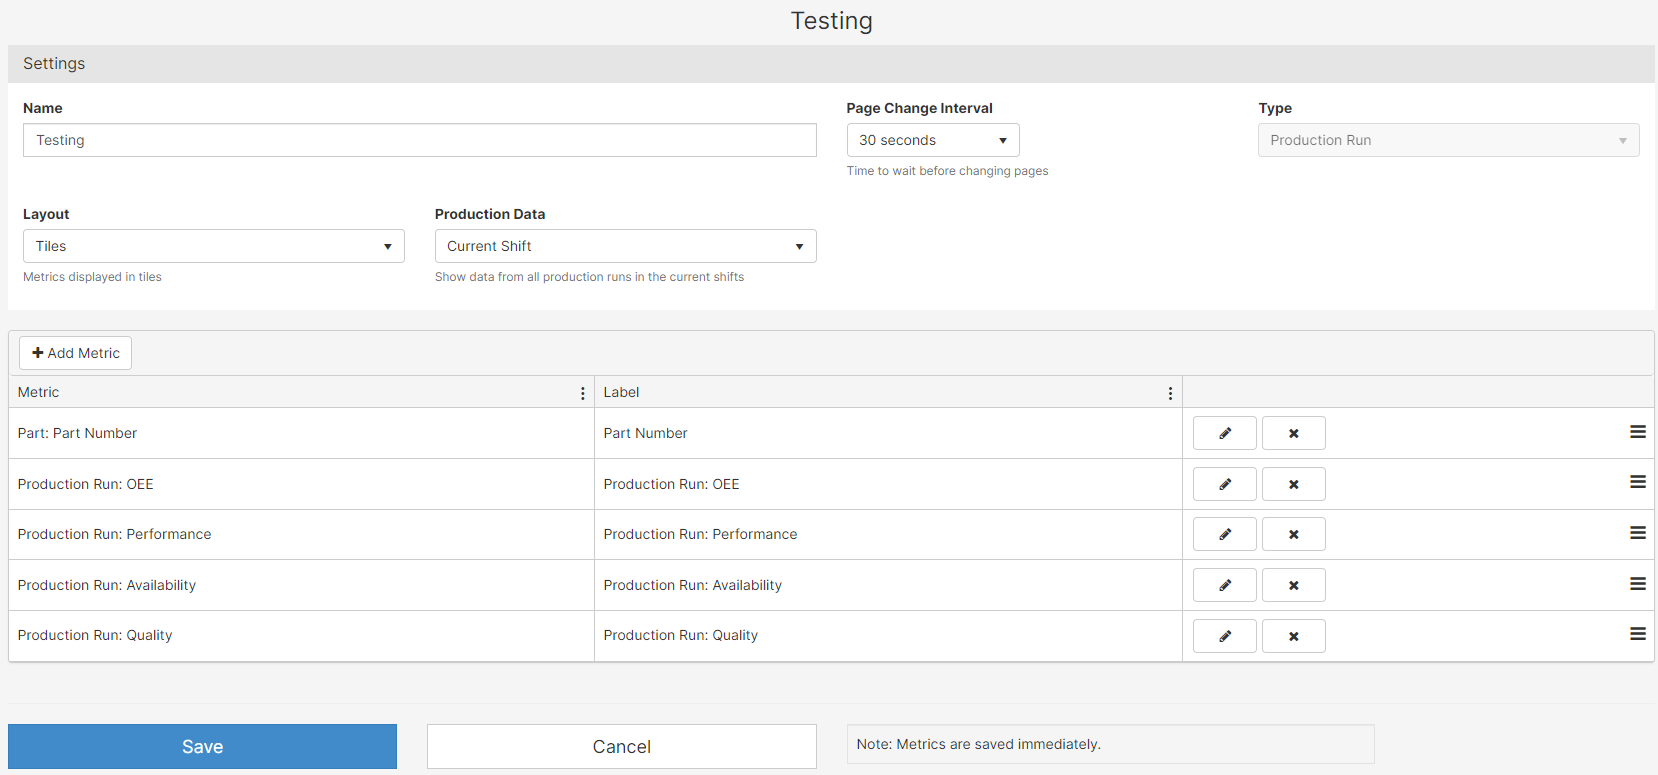
- Mingo provides different layouts for your scoreboards. In the Settings area, [Click] on Layout, and the following menu drops down: Tiles, Table with Prior Shifts, and Table.

Tile
This layout displays 9 metrics at a time, 3 rows by 3 columns. If the scoreboard has more than 9 metrics, the scoreboard will rotate to the next 9 metrics every 30 seconds.
Table with Prior Shifts
This dashboard shows shift-level information for the current shift and a configurable number of prior shifts.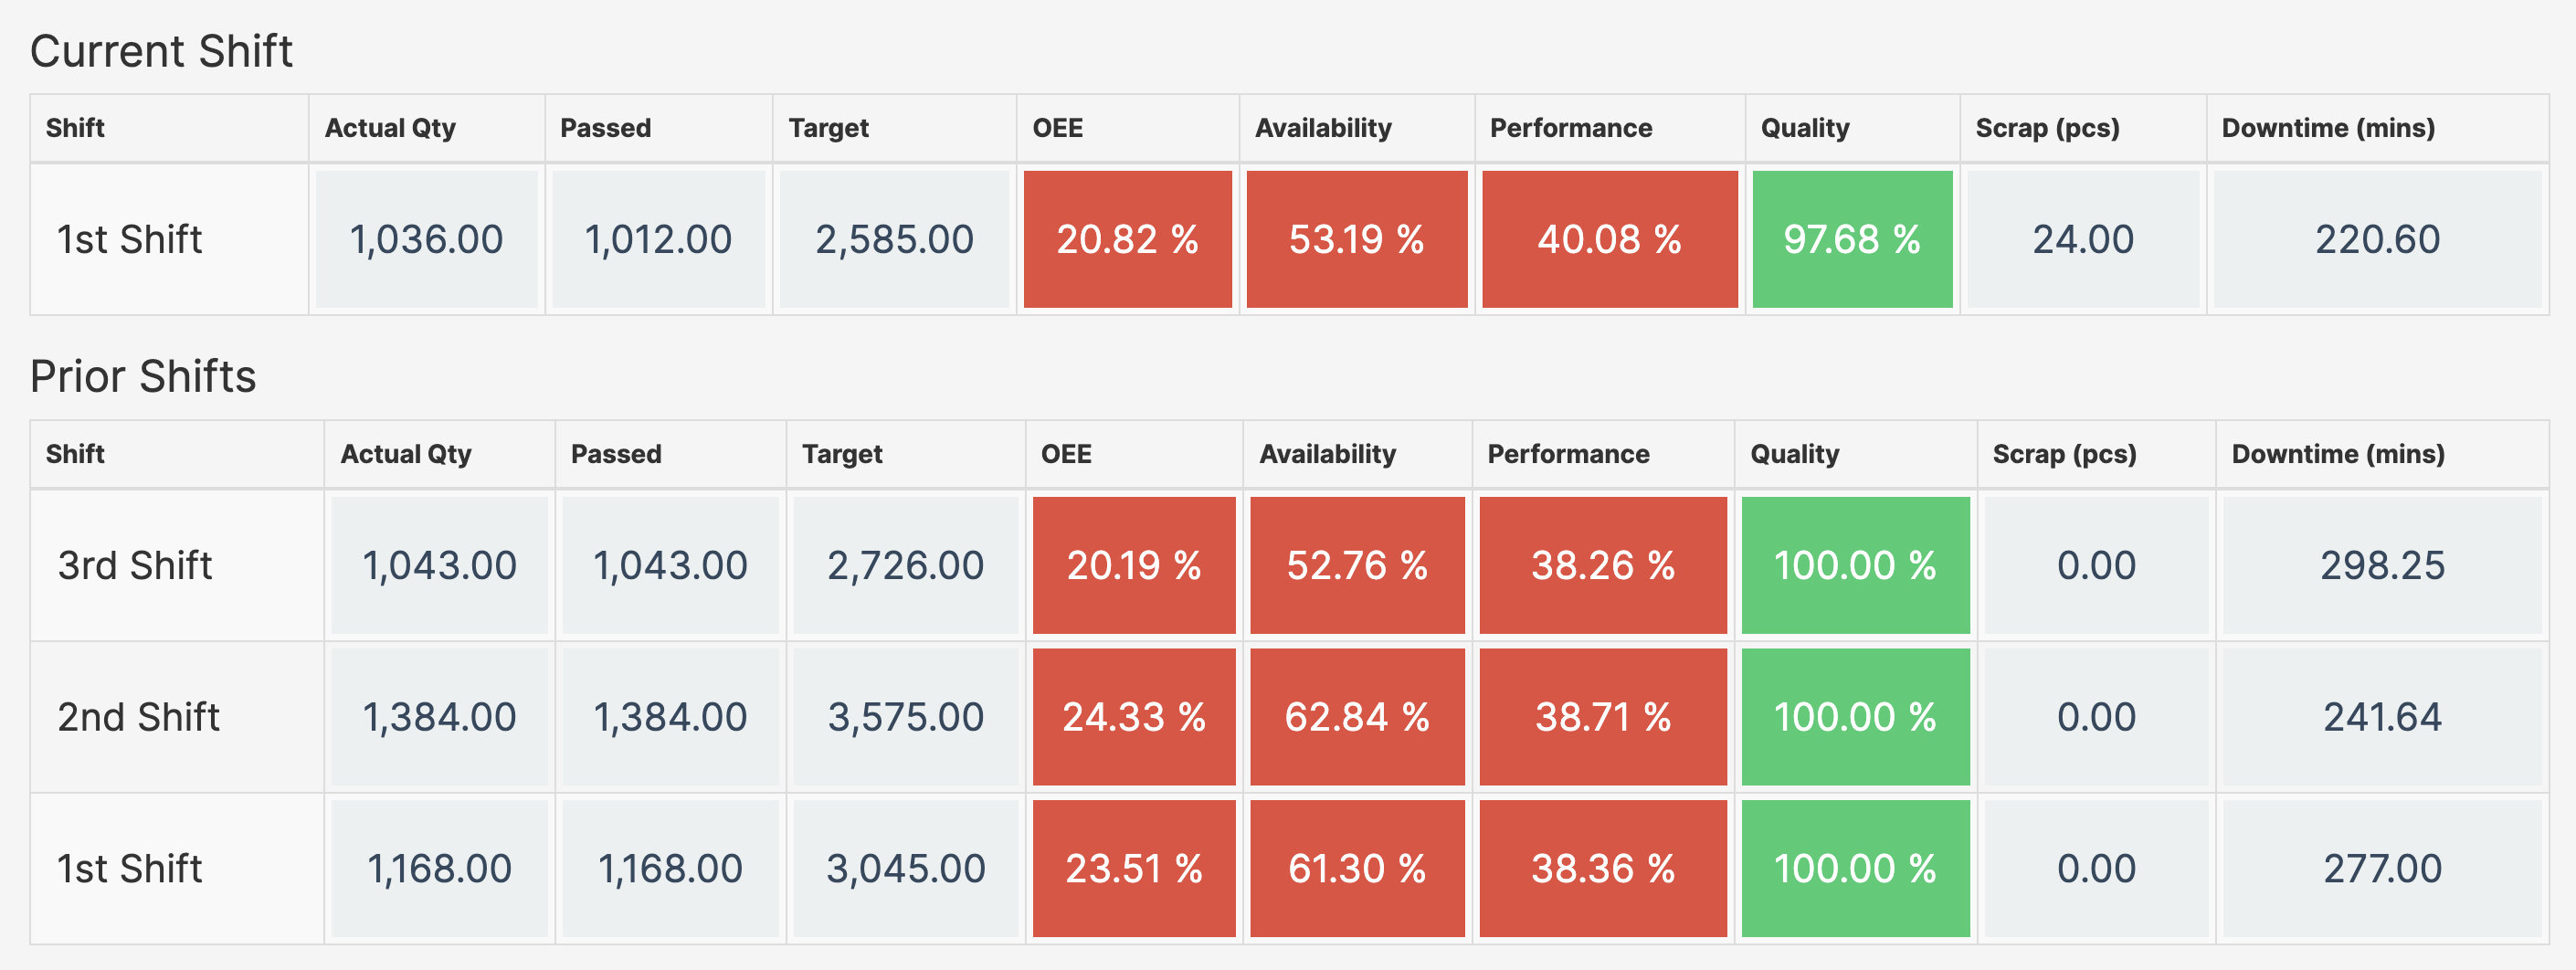
Table
The first column is the name of the cell or machine. This scoreboard typically fits 10 machines per screen. The screen will scroll automatically when there are more than 10 machines.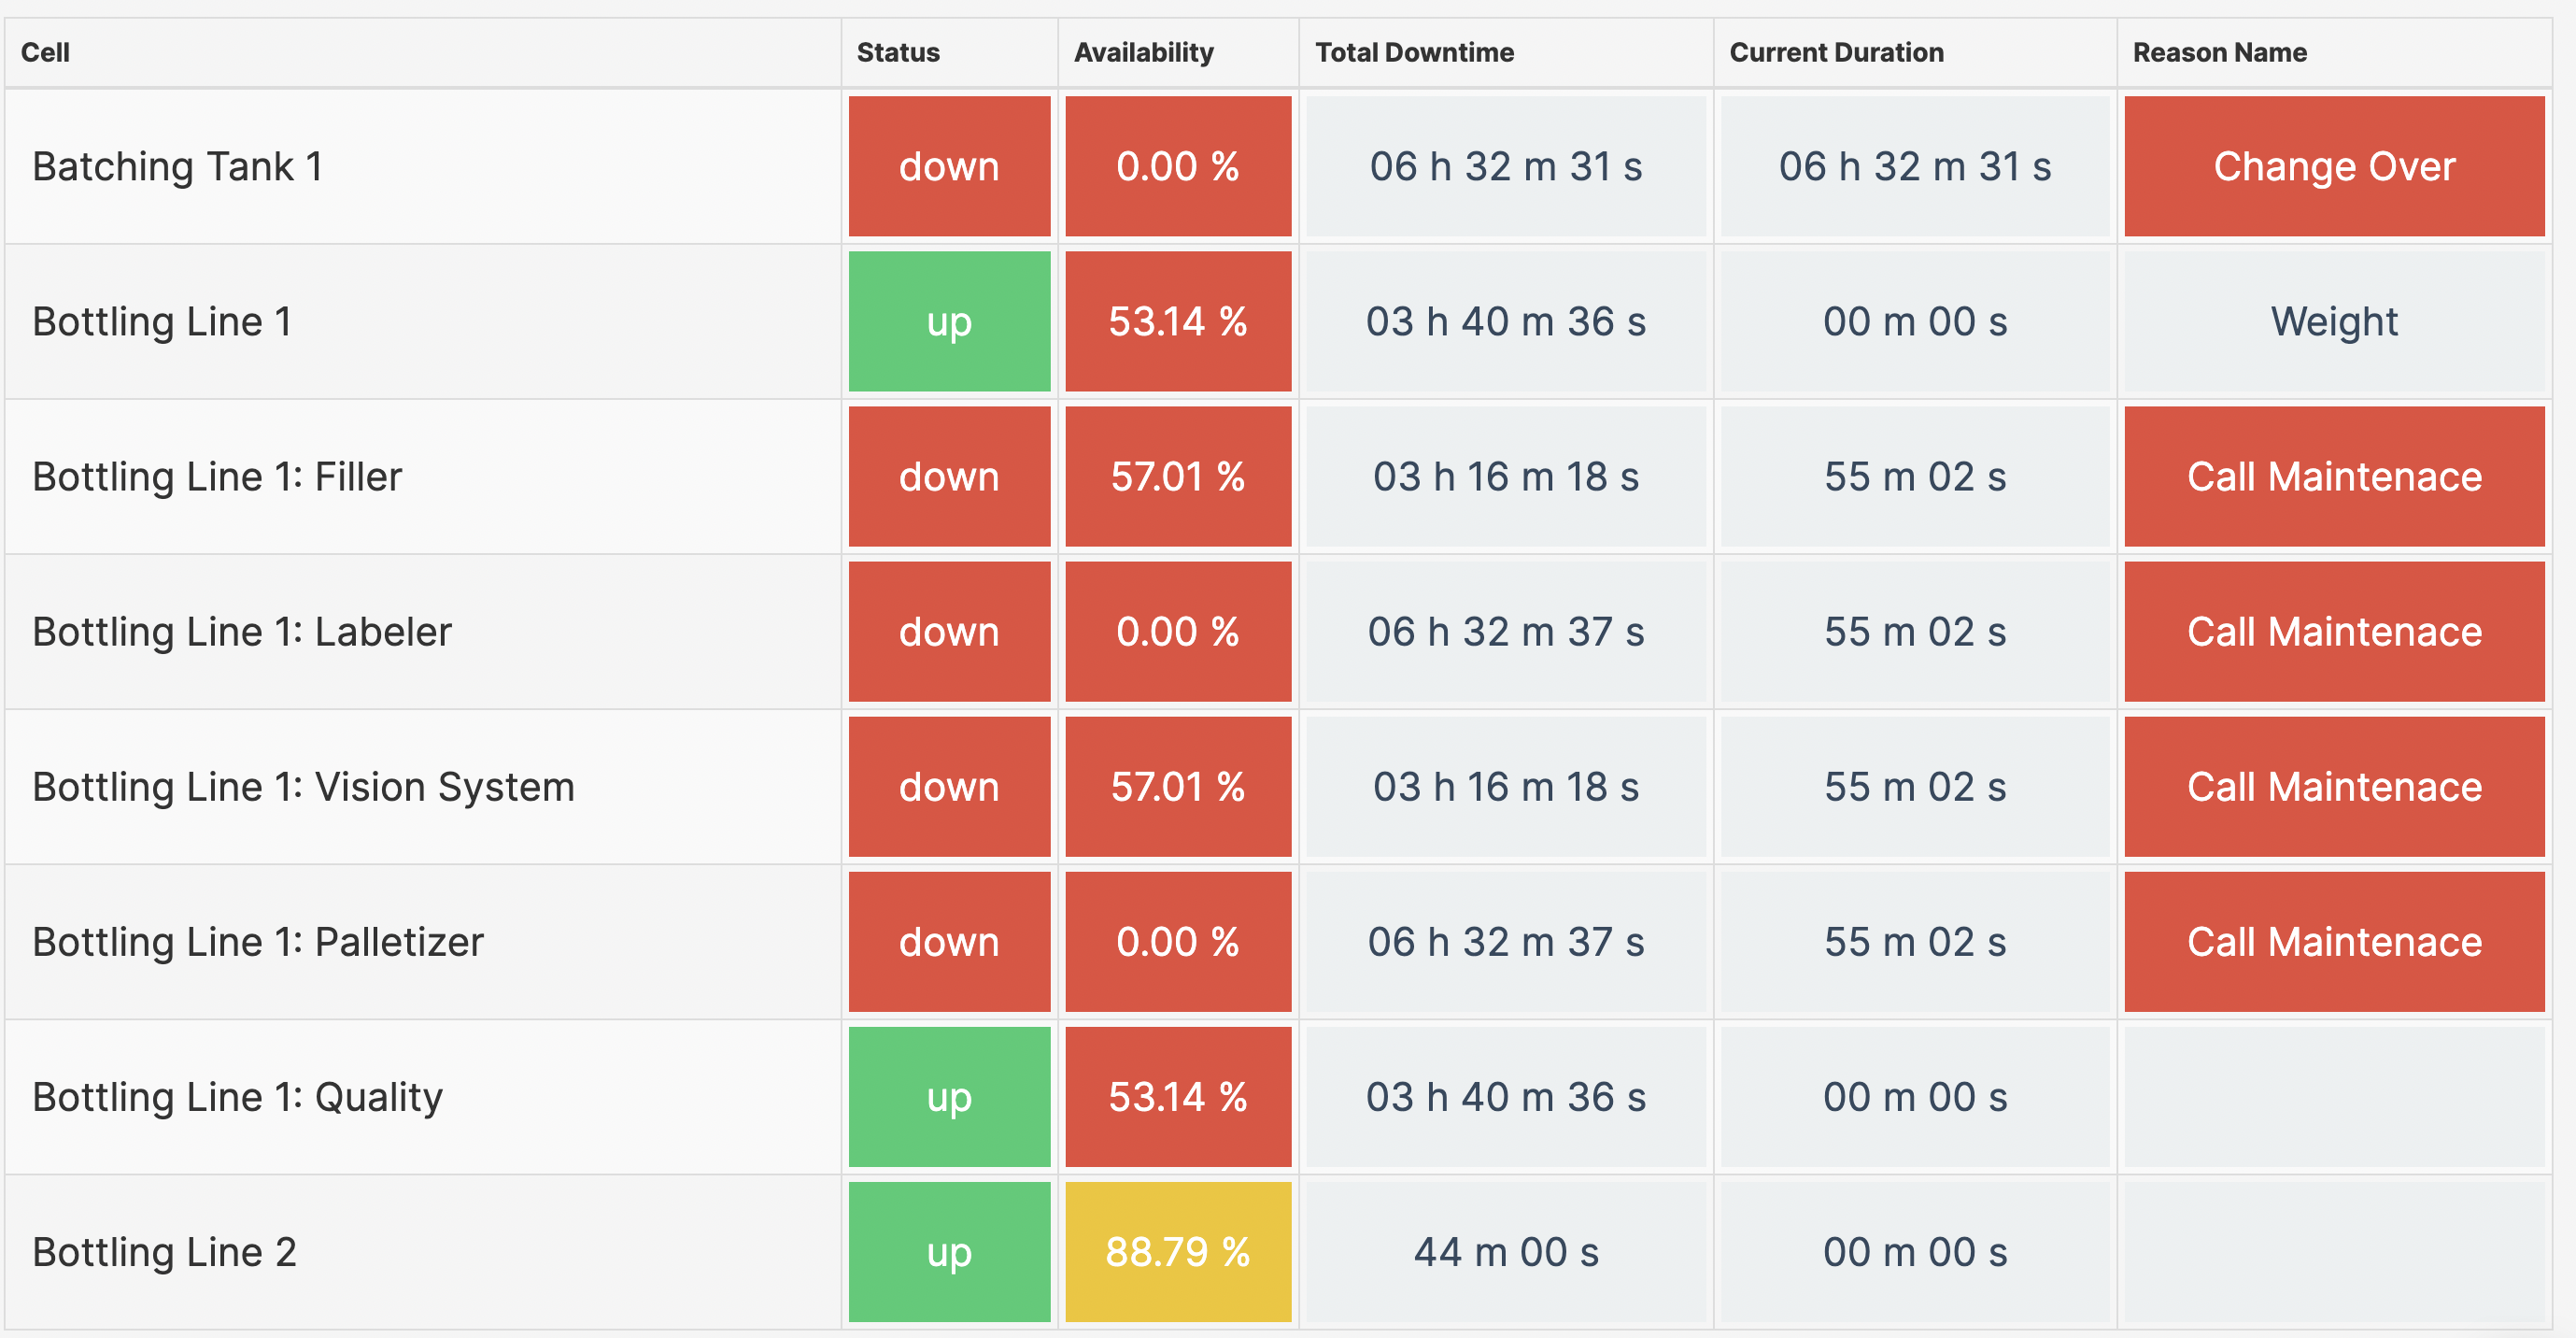
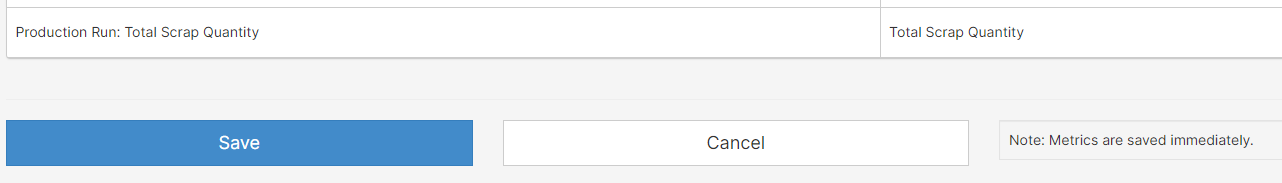
- Remember to Save your work.