Understand how OEE and its components are calculated in Mingo
Overview
OEE, or Overall Equipment Effectiveness, identifies how truly productive a run time was. OEE is composed of three factors: Availability, Performance and Quality.
OEE Calculation
OEE is an indicator, or KPI, usually used in Lean Manufacturing. This indicator provides insight into the overall performance of a machine, a line and a plant. To calculate OEE, you need to calculate its three different components: Availability (A), Performance (P), and Quality (Q).
Availability is the time a machine or cell should be running. For example, if your machine ran for 80 minutes out of the 100 minutes planned, you experienced an availability of 0.80 or 80%.
Performance is how close your actual run time was in comparison to your ideal run time. For example, if you produced a total of 72 parts (good parts and scrap) and your ideal cycle time is one piece per minute, you performed 72 minutes out of the 80 minutes the machine ran. You experienced a performance of 0.90 or 90%.
Quality represents how many of the parts you produced were actually good parts. These parts met your factories set requirements to be counted as good parts. For example, if you produced 72 parts but 7 parts were scrapped, your quality is 0.902 or 90%.
Your OEE for this example is 0.80 * 0.90 * 0.90, which equals 0.648 or 65%. Figure 1 shows you the specific formula for each component.
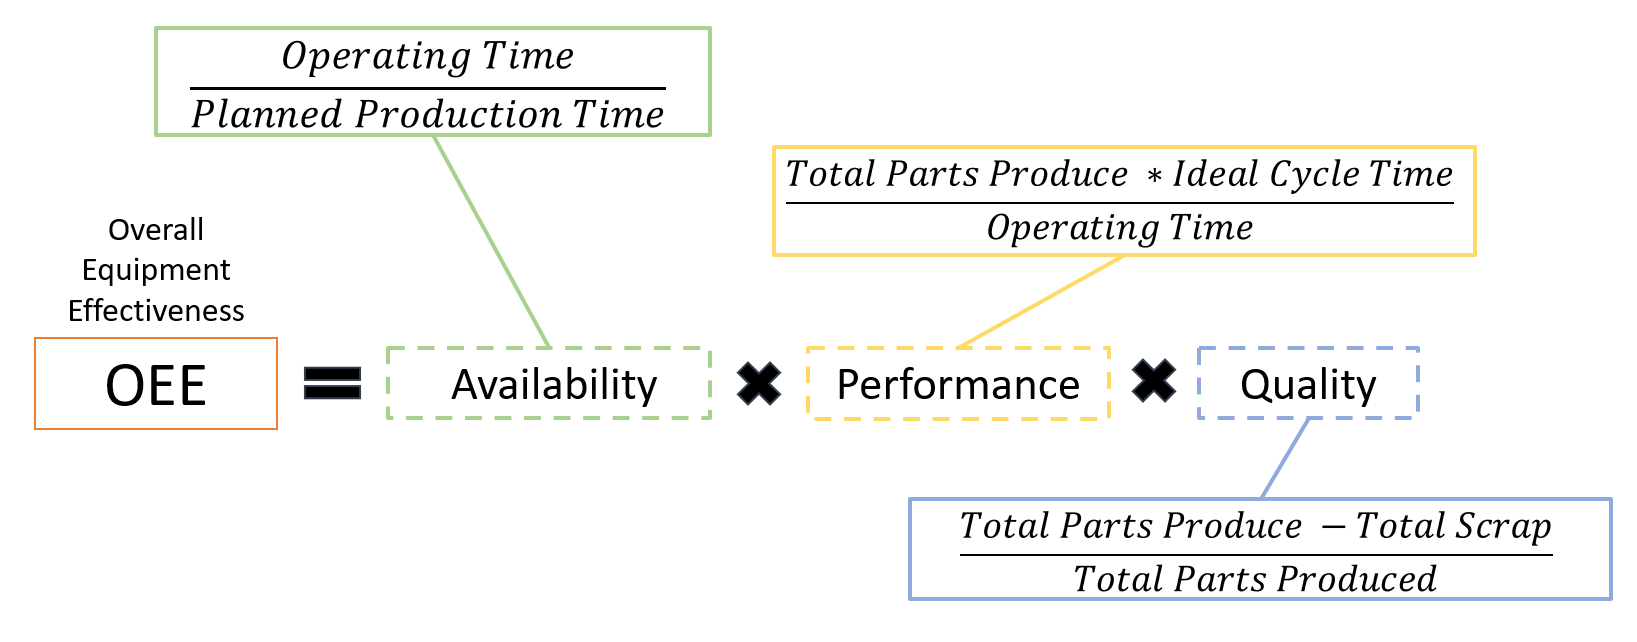 Figure 1. OEE Calculation
Note: Be consistent in your units. When referring to time it is best to use minutes thought out the components of OEE.
- Operating Time = Planned Production Time (time a cell or machine is schedule to run)
- Unplanned Downtime (an event that was not planned like breakdowns)- Planned Production Time = Shift Length (Overall Minutes in a shift)
- Planned Downtime (an event that was planned for like lunch)
- Planned Production Time = Shift Length (Overall Minutes in a shift)
- Total Parts Produced refers to scrap and good quantity. It is any units you produced during your shift.
- Ideal Cycle Time is the time it takes your machine to operate under optimal circumstances. In other words, the ideal time to produce one unit.
- Total Scrap is any discarded material produced.
Let's look at the example with the Mingo OEE Calculator. As you input the data into the calculator (Figure 2), you can see the numbers of the Cell Status Widget change (Figure 3). Now, imagine how much time you can save if the numbers were being pulled directly from your PLC, probably less than what it took me to write this article.
 Figure 2. Mingo Input Data
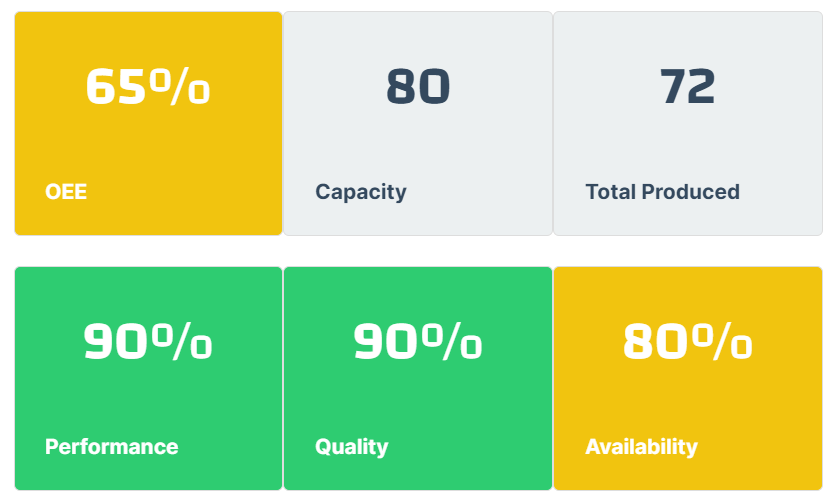 Figure 3. Cell Status Widget