February and March 2020 Updates Updates to the software to improve experience.
The Highlights
- Added Custom Fields for Production Screens - The update allows for more flexibility in the type of data gathered and calculated from an operator.
- Schedule and Work Management Module - Determine if you're ahead or behind schedule and on track to "win the day".
- Updated Operator Screen - The updated version of the operator screen offers a more clear picture of operator performance throughout a shift.
- Shift Based Scoreboards - The shift-based scoreboards allow you to look at a single machine or line and analyze current performance and compare it to a prior number of shifts.
- Gateway Management & Health Checks - This allows our team to track the gateway's performance - is it currently on and running or down?
- Updated Timeline Widget - This makes it easy to see where you had problems and what was running at that particular time.
- Downtime Reason Prompt for the Operator - This particular addition signals if a machine is down and prompts the operator for the reason why.
- Default Quantity to 1 on the Operator Screen - The automated quantity reduces the amount of data someone has to enter, making running a report much quicker.
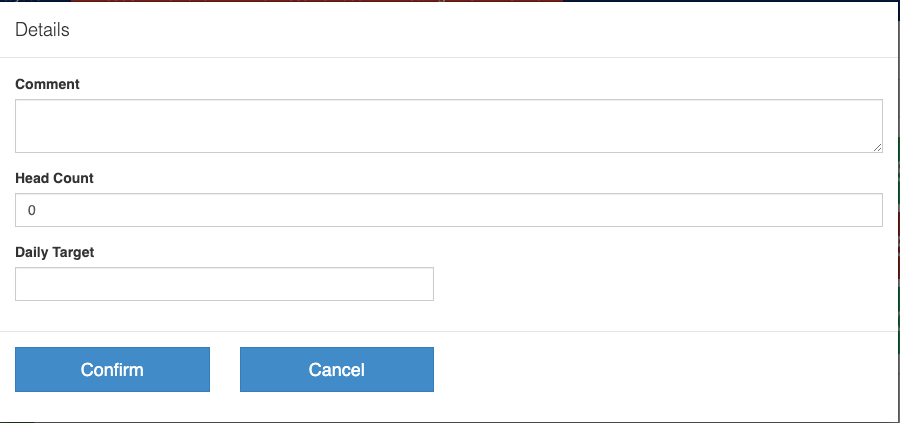
Added Custom Fields for Production Screens
We added the ability to add custom fields on the operator screen so you can now collect additional data from your operators. The list of additions is endless, but for example, add things like actual takt time, headcount targets (if you're not using the scheduling module), machine settings, thresholds, and more.
Use the custom fields in the dashboards and scoreboards to see them anywhere.
The update allows for more flexibility in the type of data gathered and calculated from an operator.
Schedule and Work Management Module
In summary, the scheduling module will import or create a schedule, provide the opportunity to make minor adjustments in SensrTrx, easily assign the work orders or jobs to the machines, electronically communicate that to your operators, and track against the jobs and quantity associated.
Determine if you're ahead or behind schedule and on track to "win the day".
Updated Operator Screen
The updated version of the operator screen offers a clearer picture of operator performance throughout a shift. Now, you can see shift level information as well as job and work order information on the same screen.
The operator can tell how far ahead or behind schedule they are in terms of time, product, and/or parts. The idea is that it really focuses on the metrics that matter and can improve both productivity and efficiency.
The blue bar in the "current job" box in the screenshot below tracks the completion percentage against the job.
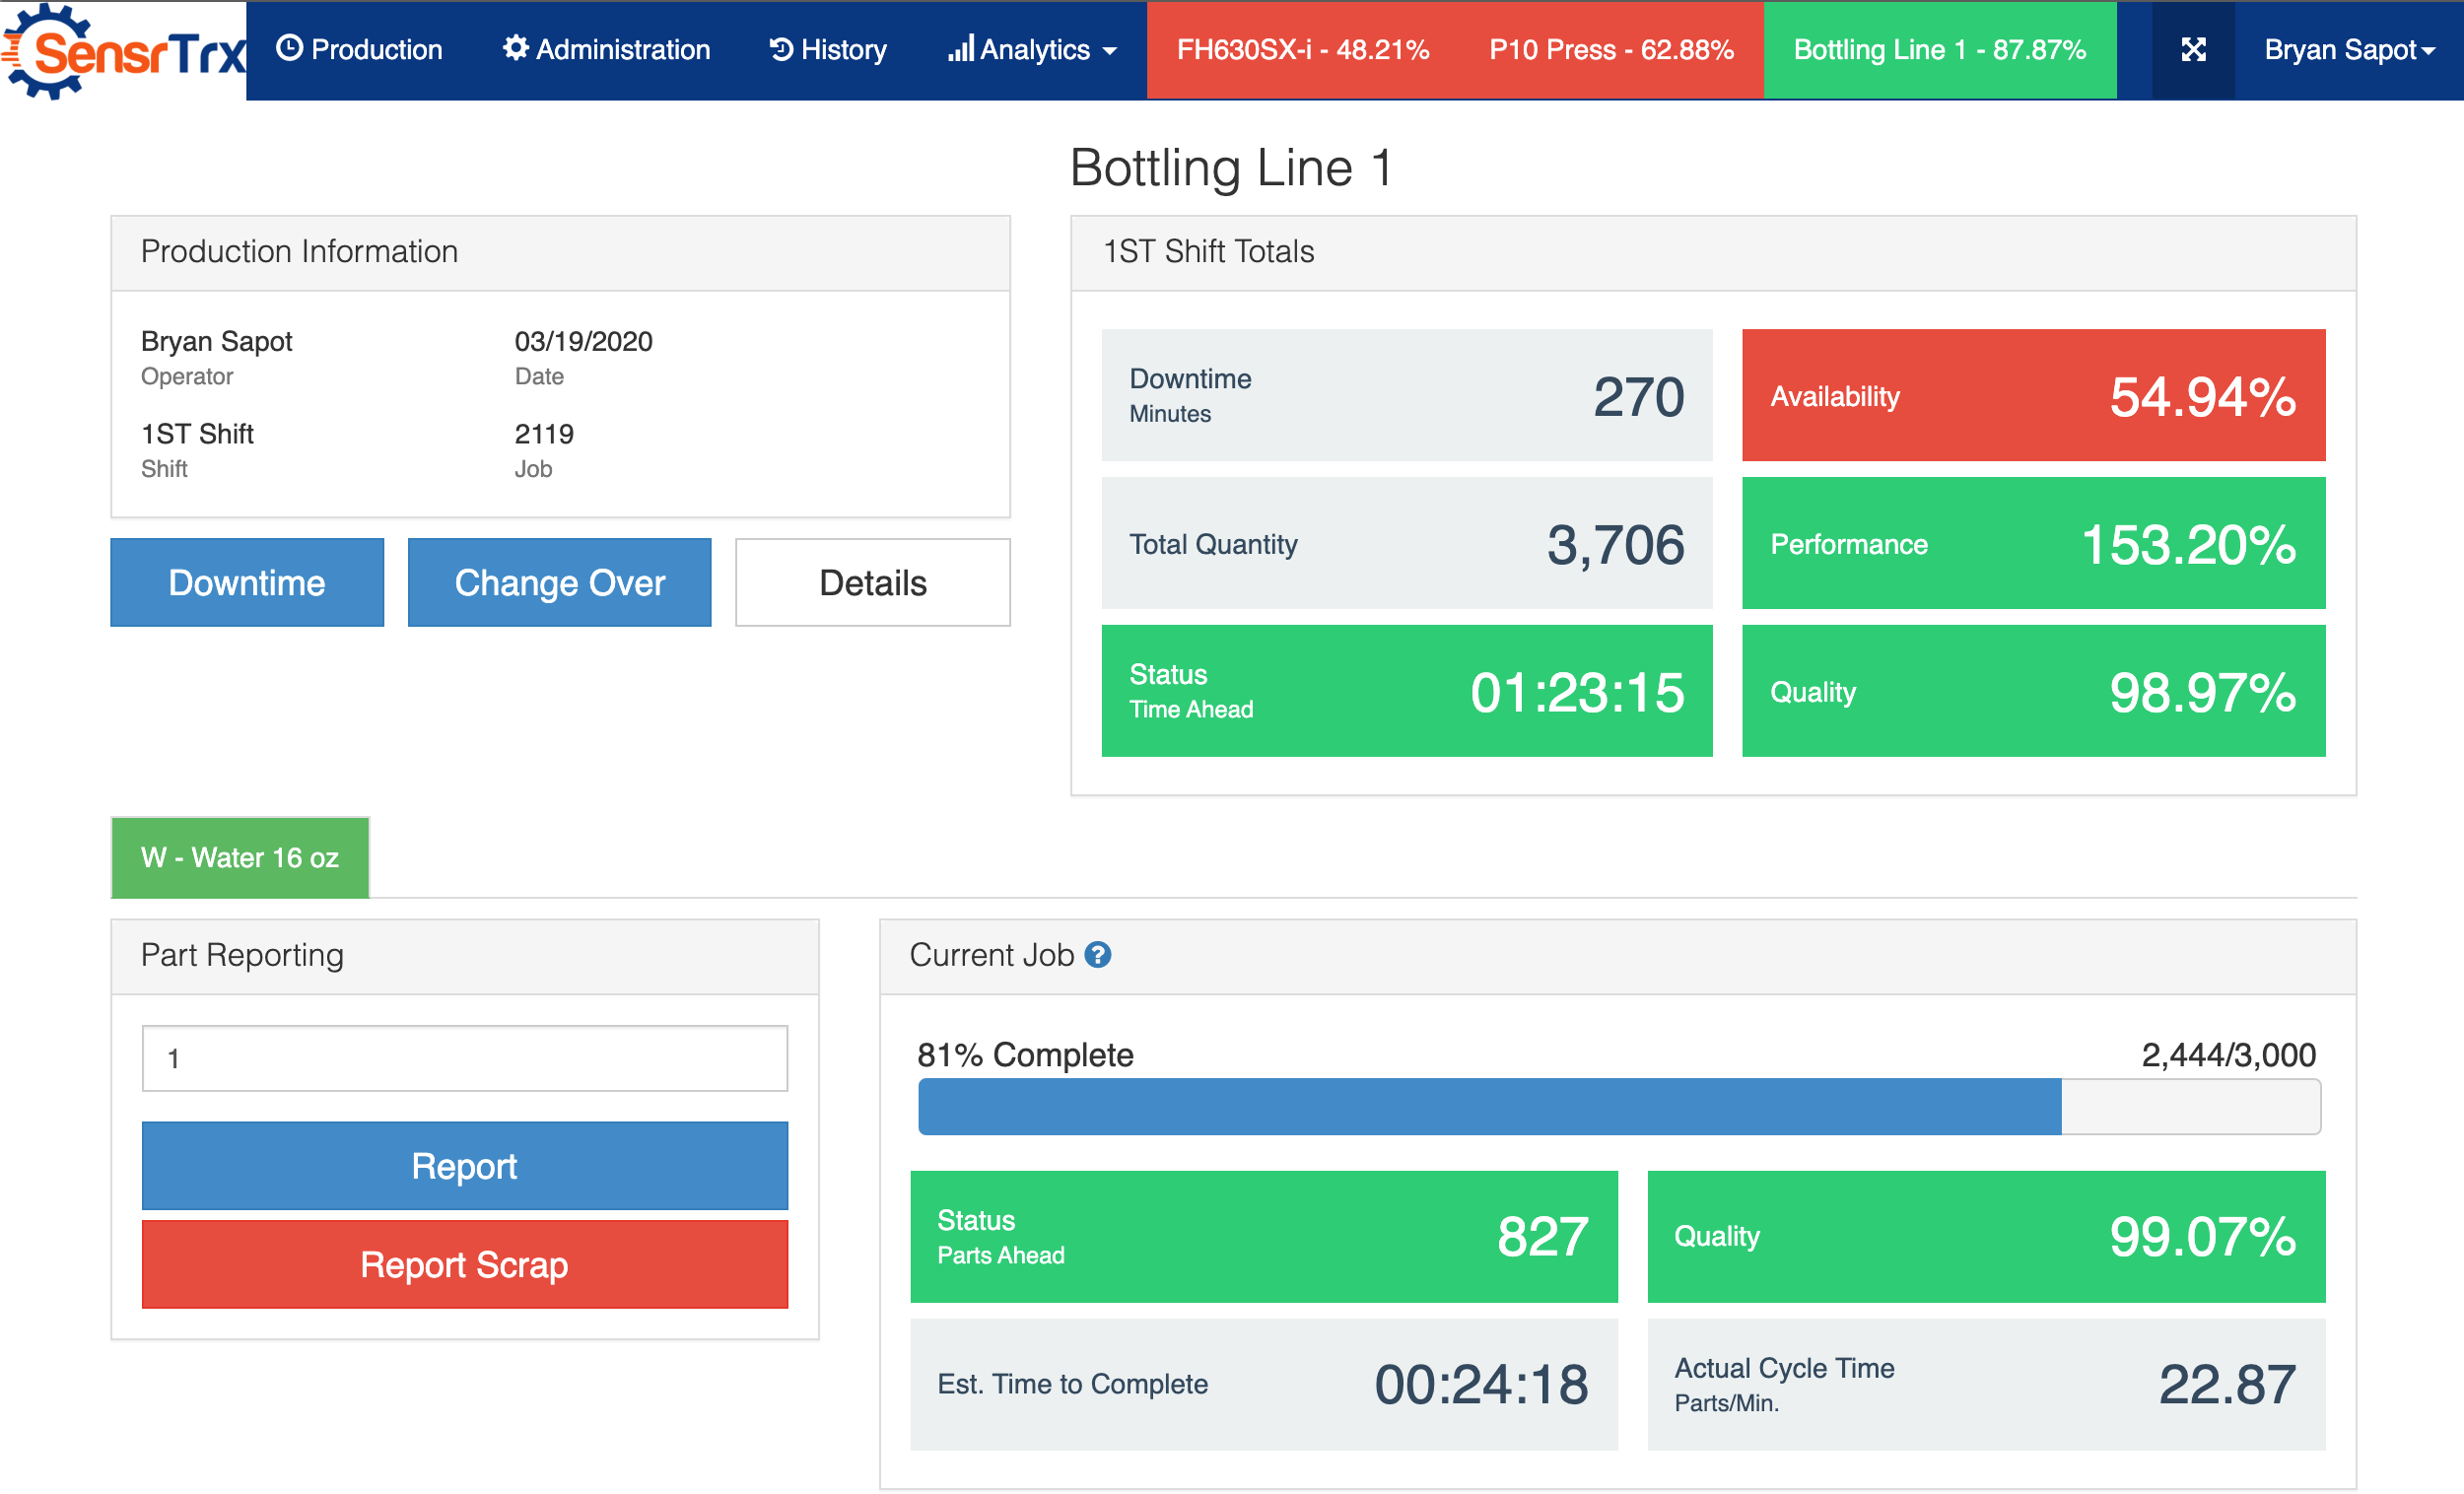
Note: The updated operator screen is available for everyone, but needs to be turned on. Contact support for assistance.
Shift Based Scoreboards
The shift-based scoreboards allow you to look at a single machine or line, analyze current performance, and compare it to a prior number of shifts. For example, look at the current shift's performance and compare that to the last three.
You will be to look at the comparisons on one screen and in real-time.
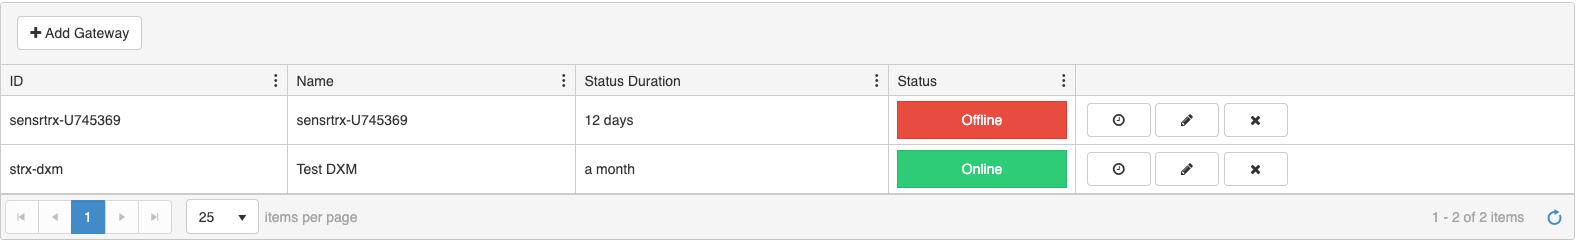
Gateway Management & Health Checks
This allows our team to track the gateway's performance - is it currently on and running or down? If the gateway is down for more than a minute, alerts will be sent to whoever needs it.
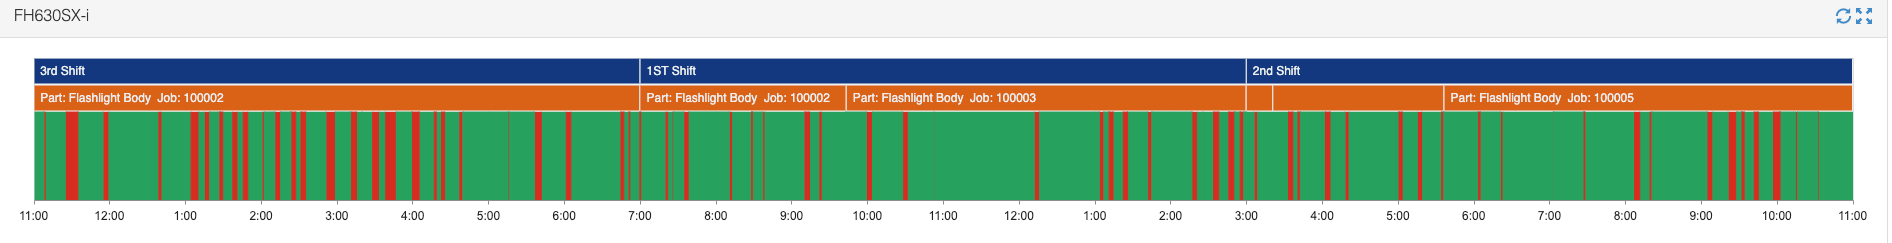
Updated Timeline Widget
- The widget was updated to provide improved accuracy.
- There is now an orange bar (see screenshot below) that makes it easy to see where you had problems and what was running at that particular time.
Downtime Reason Prompt for the Operator
This particular addition signals if a machine is down and prompts the operator for the reason why.
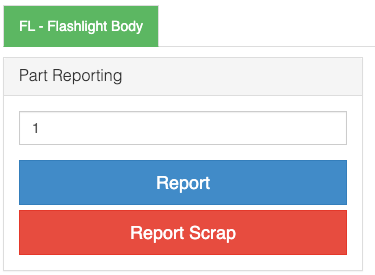
Default Quantity to 1 on the Operator Screen
The automated quantity reduces the amount of data someone has to enter, making running a report much quicker.
 Did this answer your question?